
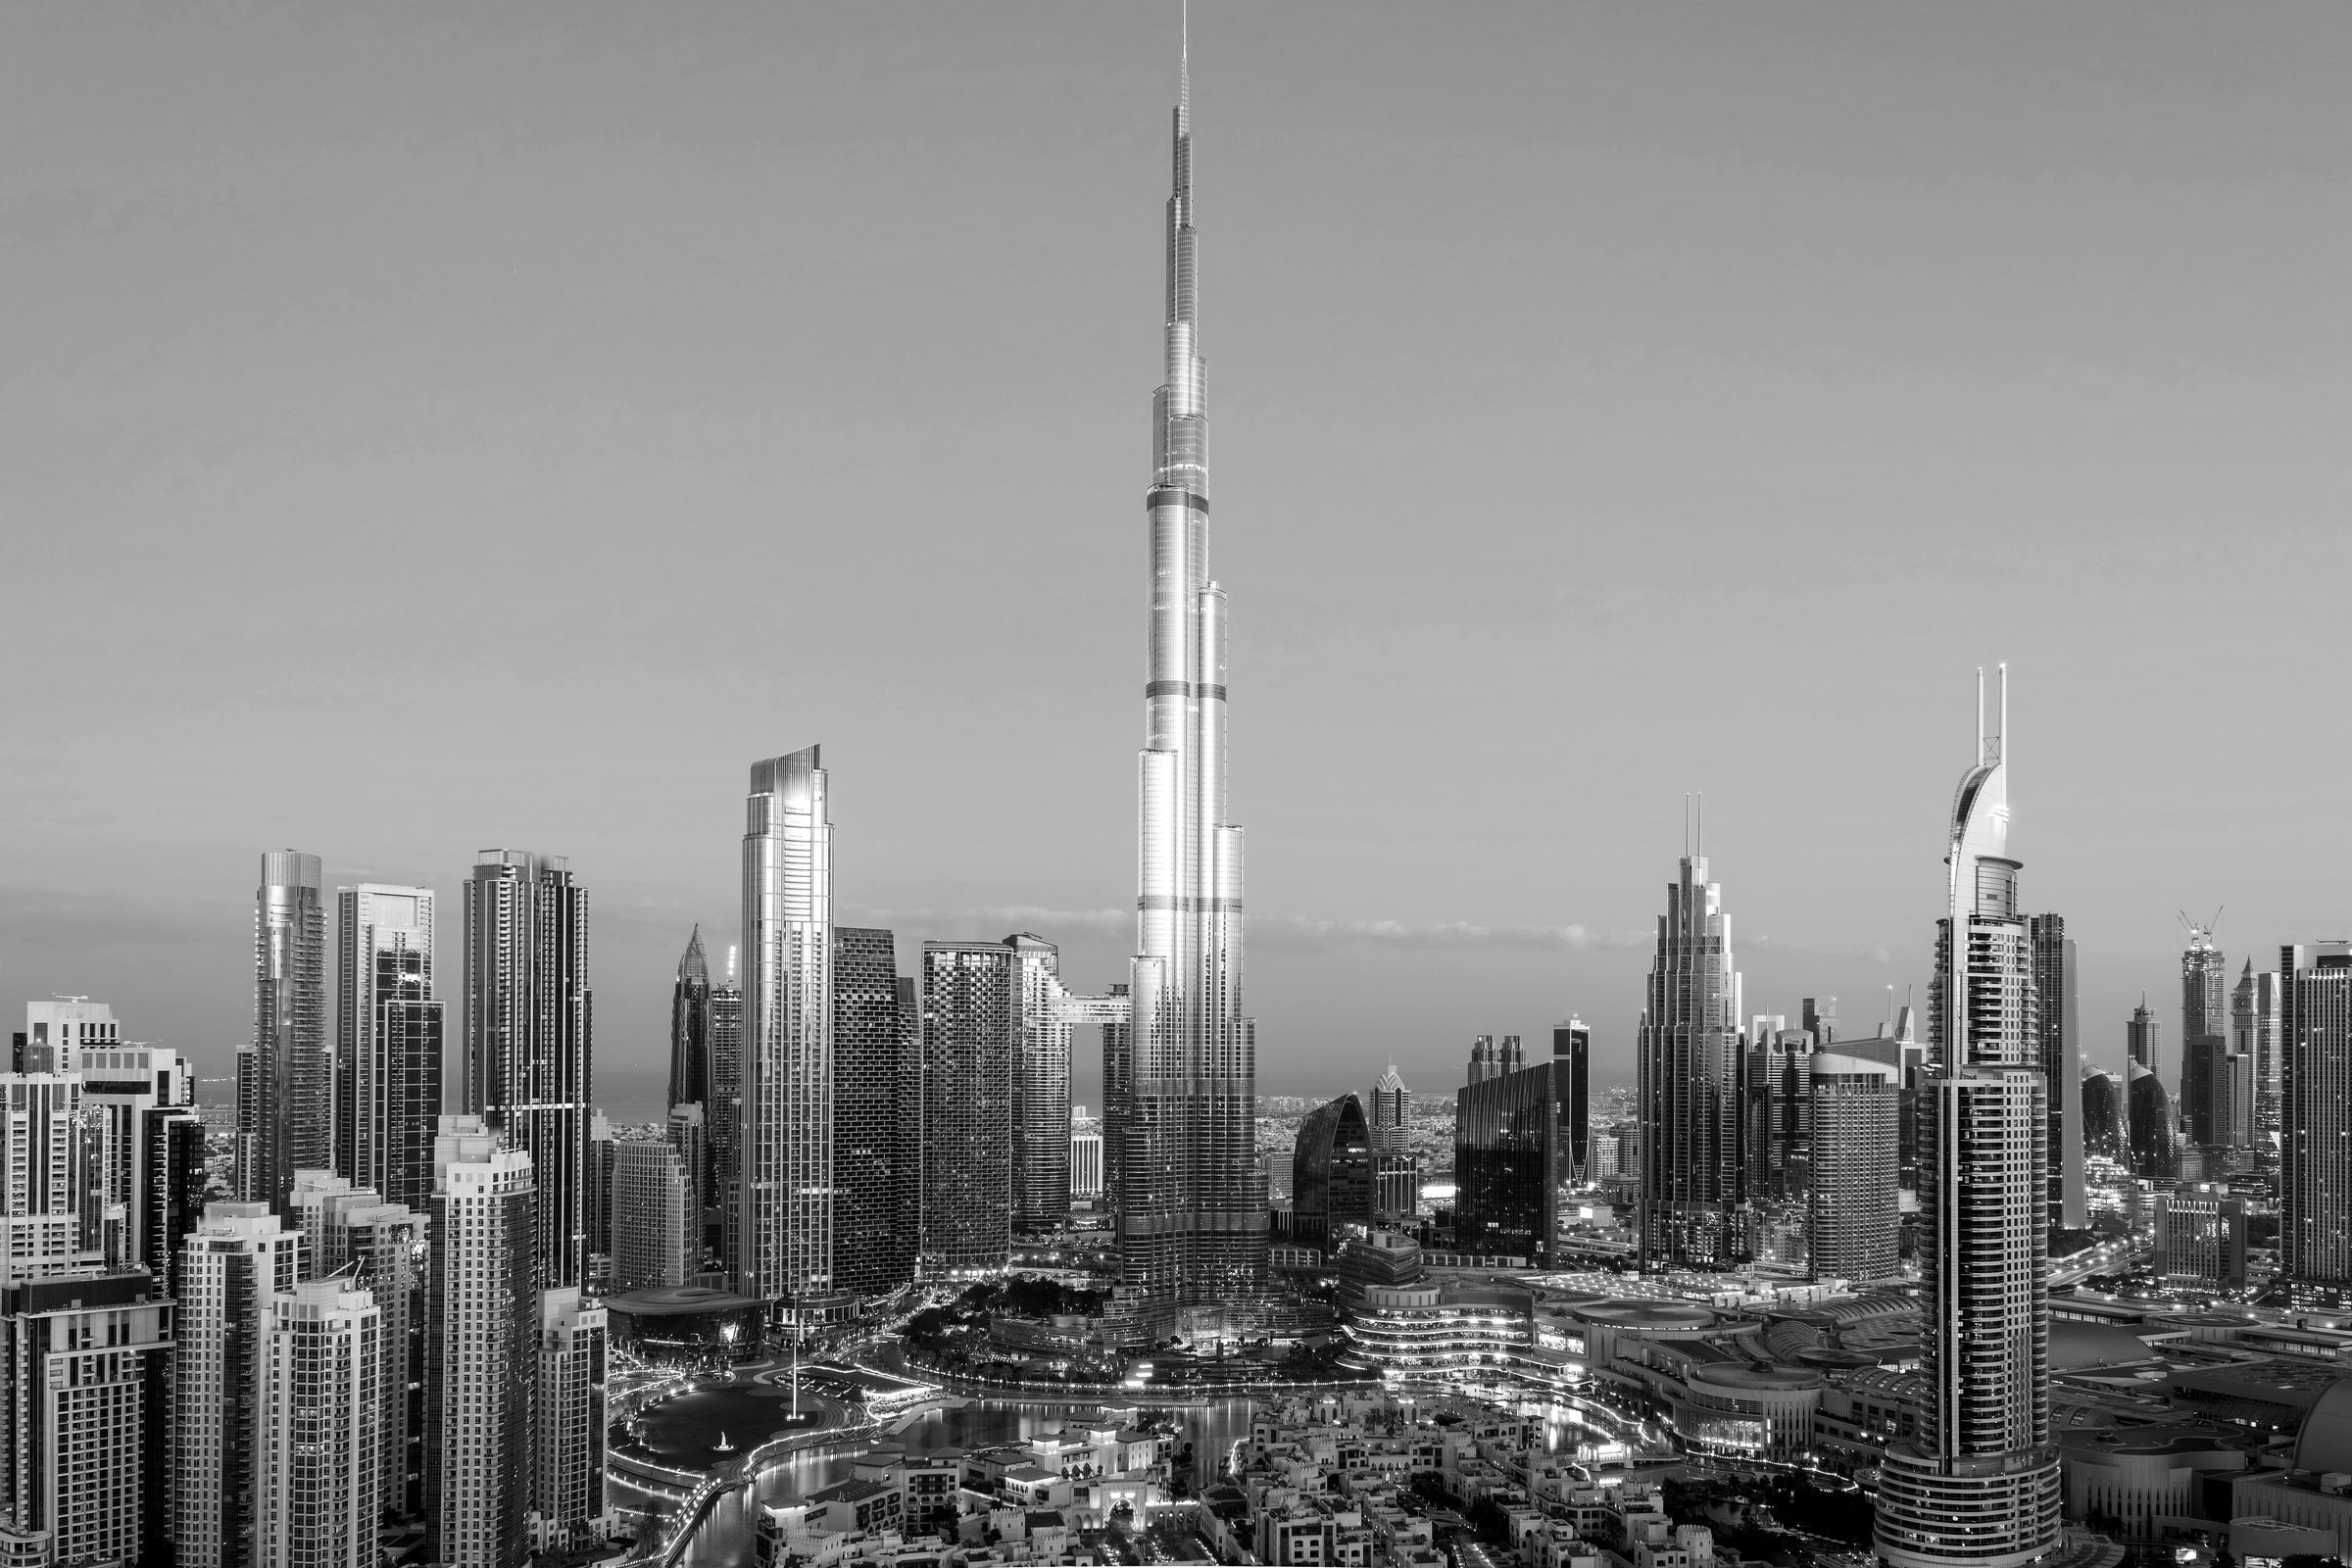

Who Ledgard is for
- Families and investorsWe use Ledgard in our advisory work to check a property, a building or a whole portfolio against the registered record before a decision is made.
- FirmsMonthly values for a loan book, price checks before a deal is signed, and independent prices for tokenised property.
- BuyersEnter a listing and read the report yourself. Three free reports, no card required.
Built from Dubai government records
Ten official registers, with registered sales from 2000 and rental contracts from 2005.
Every figure in a Ledgard report is built from Dubai government records, and each source is named in the report. Where the record is silent, Ledgard says so rather than estimating.
- Registered salessince 2000
- Valuationssince 2000
- Ejari rental contractsevery registered contract
- Mollak service chargesevery building
- Projectsevery registered project
- Developersevery registered developer
- Unitsevery registered unit
- Buildingsevery registered building
- Landevery registered plot
- Brokersbroker register, as published
For firms
- For banks and mortgage lendersCollateral value monitoringA monthly check of every property in your loan book, so a falling value shows up before it becomes a problem.
- For tokenised property platformsIndependent price checksOnce tokens trade, investors need to know whether a token price is fair against the real market.
- For brokers, developers and compliance teamsTransaction price screeningCheck a deal price against the registered market before signing, and keep the result on file for your compliance team.
Send us up to ten properties. We return their values, flags and evidence so you can test the results against your own figures.
Click to copyThe same property, four different sets of numbers
Buying in Dubai means hearing about the same property from several people at once. A developer's brochure, the same property listed by several agents with different figures, several portals, a message with numbers in it that appear nowhere else. Each source sounds confident and no two of them agree.
The difficulty is not finding information. It is knowing which of it to rely on. It happens to first-time buyers, and it happens to experienced investors.
What the property report covers
Twelve of its 22 sections, grouped by what they tell you. Open a card to see the page it sits on in the sample report.
Price and cost
The project
The property
The agent and the title
How it works
- 01Enter the property detailsArea, project, size and asking price, taken straight from the listing you are considering, entered through the guided form.
- 02Generate the reportEvery figure is computed in code from officially registered property records, nothing estimated.
- 03Read the evidenceThe registered prices, rents and costs, stated plainly and in full, so you can decide with the facts in front of you.
The more expensive the area, the lower the rental yield
Gross rental yield in %: the median yearly rent divided by the median sale price, from registered records. The median price is shown next to each area.
- Arjan6.92%AED 895,500 (USD 244,000)
- Dubai Science Park6.90%AED 1,087,146 (USD 296,000)
- Jumeirah Village Circle6.80%AED 1,000,000 (USD 272,000)
- Dubai Silicon Oasis6.49%AED 880,000 (USD 240,000)
- Jumeirah Village Triangle6.14%AED 1,139,298 (USD 310,000)
- Dubai Sports City5.97%AED 922,000 (USD 251,000)
- Jumeirah Lakes Towers5.69%AED 1,811,465 (USD 493,000)
- Downtown Dubai5.56%AED 2,700,000 (USD 735,000)
- Dubai Marina5.53%AED 2,260,000 (USD 615,000)
- Palm Jumeirah5.08%AED 3,934,162 (USD 1,071,000)
- Business Bay5.00%AED 1,800,000 (USD 490,000)
- Dubai Design District4.64%AED 3,727,500 (USD 1,015,000)
Arjan and Jumeirah Village Circle return close to 7% on a median price near AED 1 million (USD 272,000). Palm Jumeirah and Dubai Design District return around 5% on prices near AED 4 million (USD 1.1 million). Rents rise more slowly than prices, so in expensive areas part of the price pays for the address, not for the rent.
Source: Dubai Land Department and Ejari. Medians over the twelve months to 16 September 2026, for the 57 areas with at least 200 registered sales and 200 registered rental contracts; twelve shown.
Read a report before you pay for one
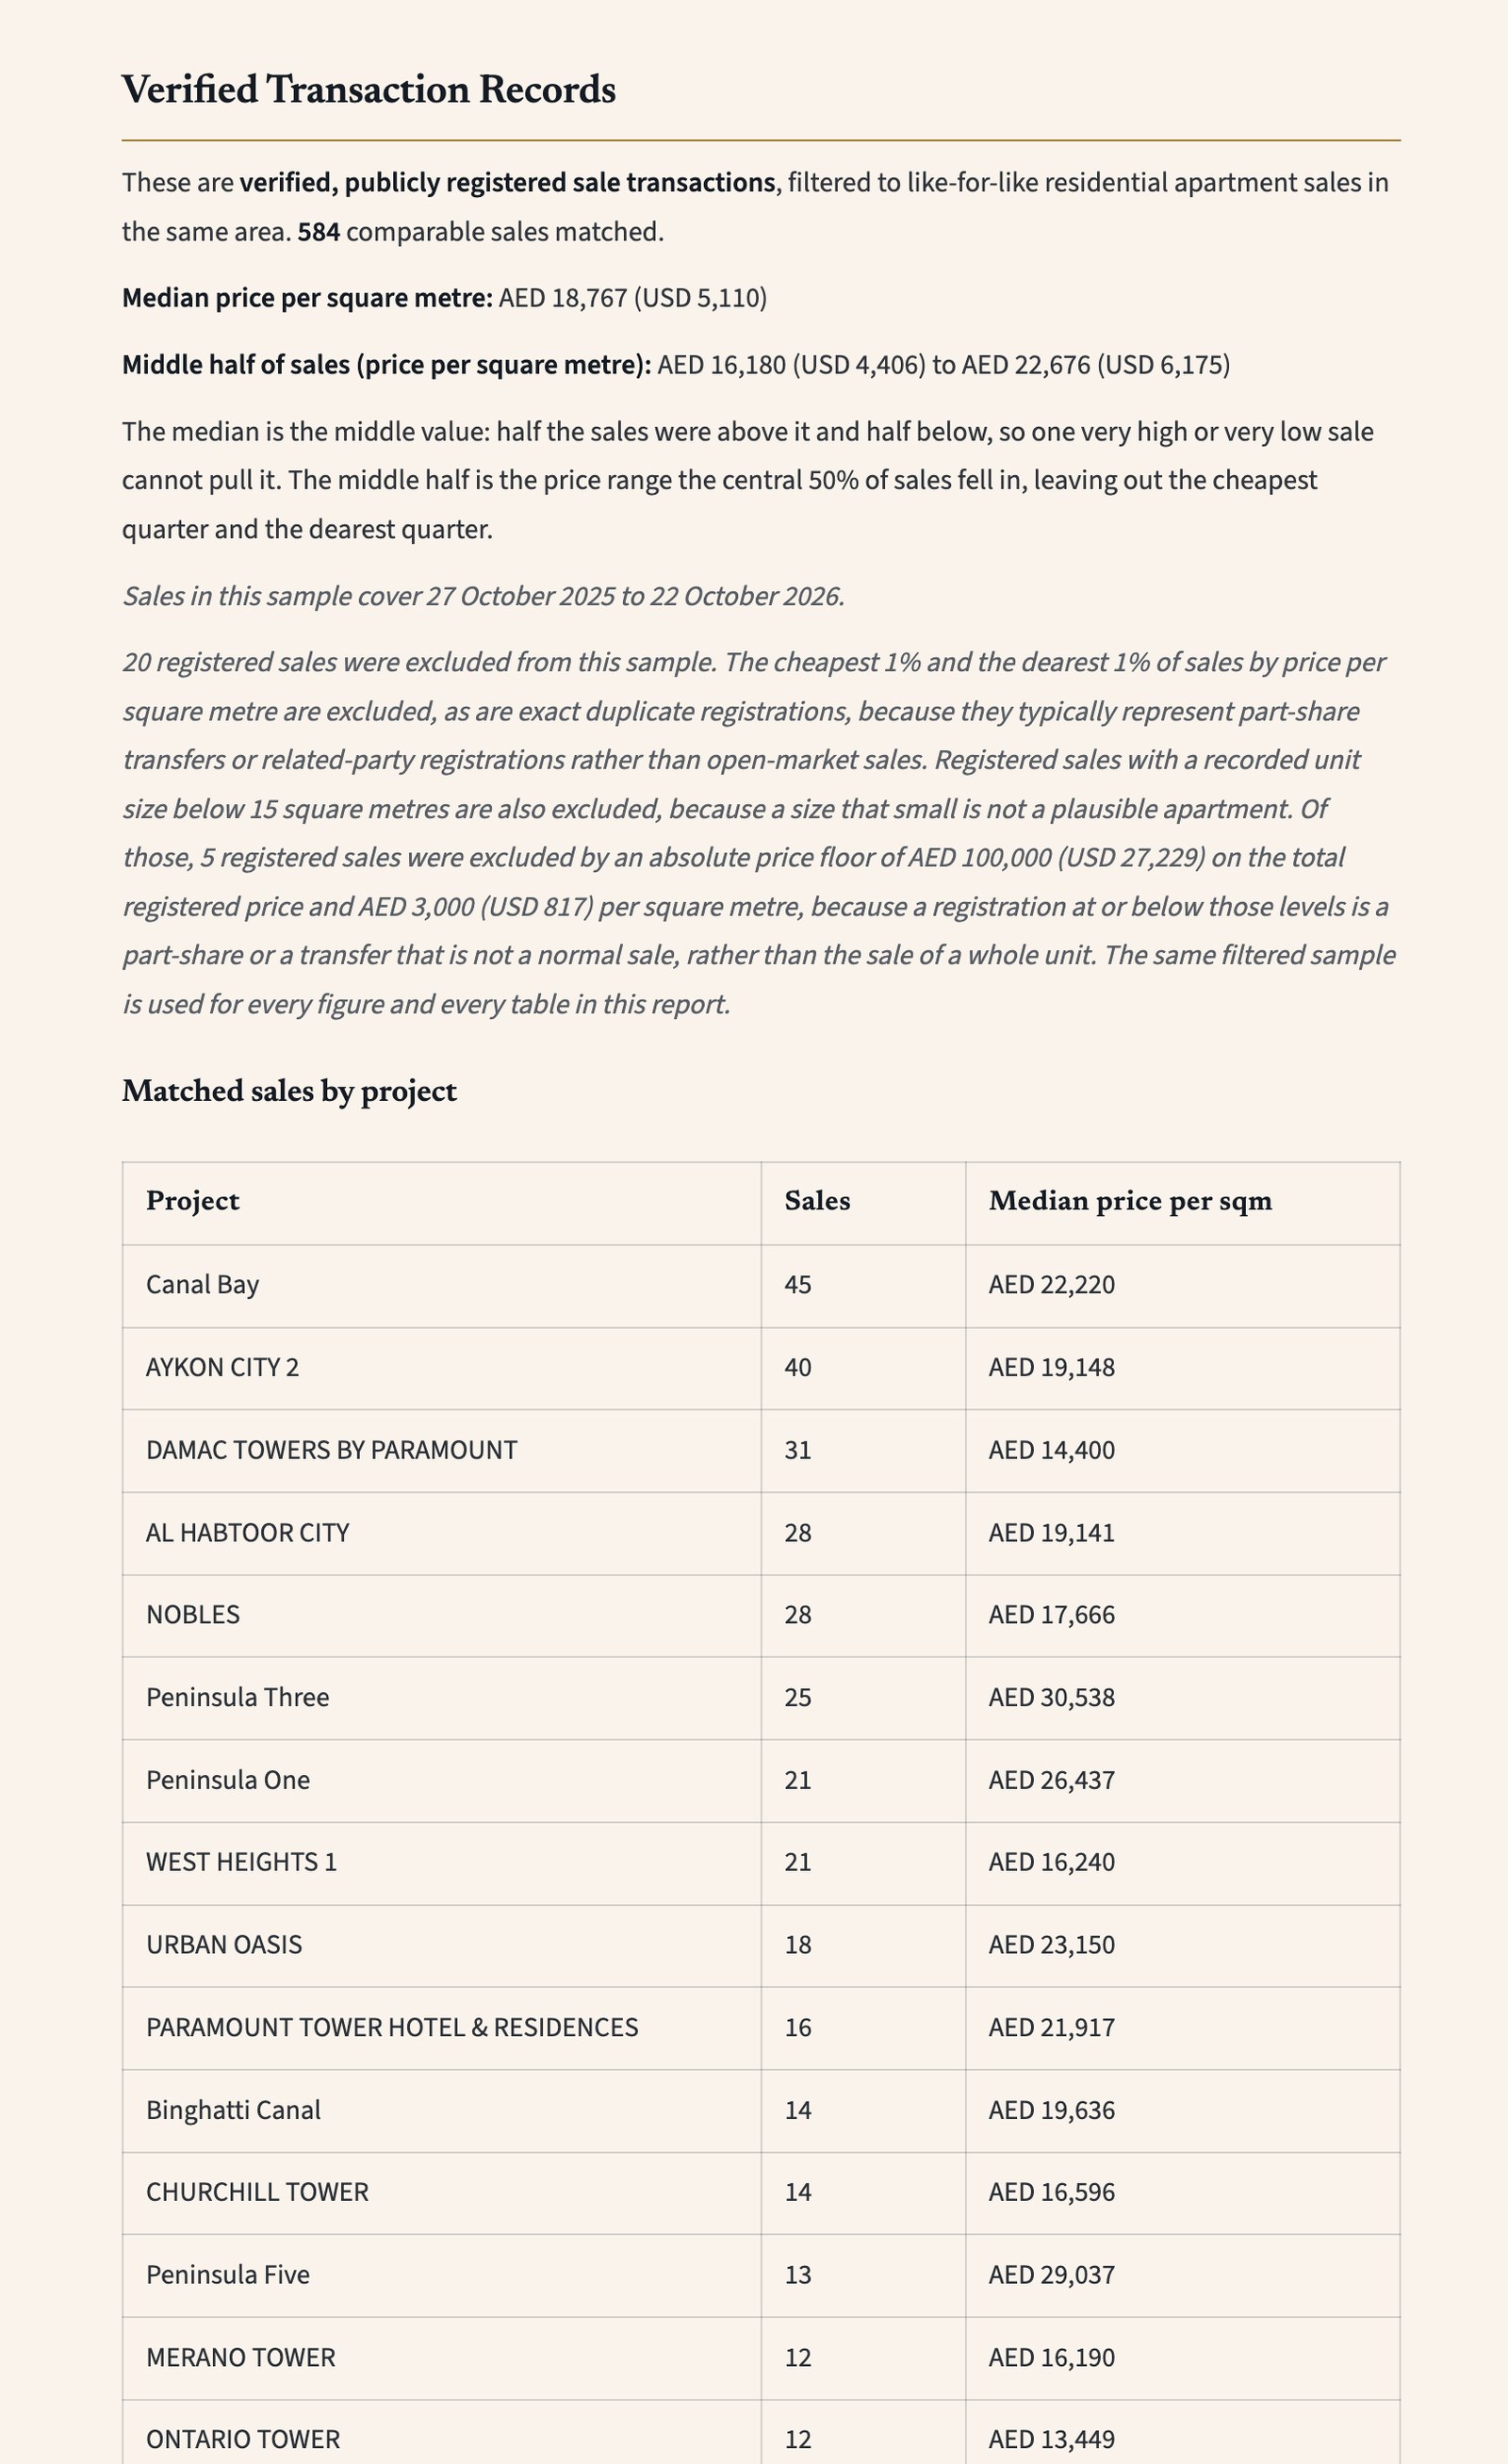
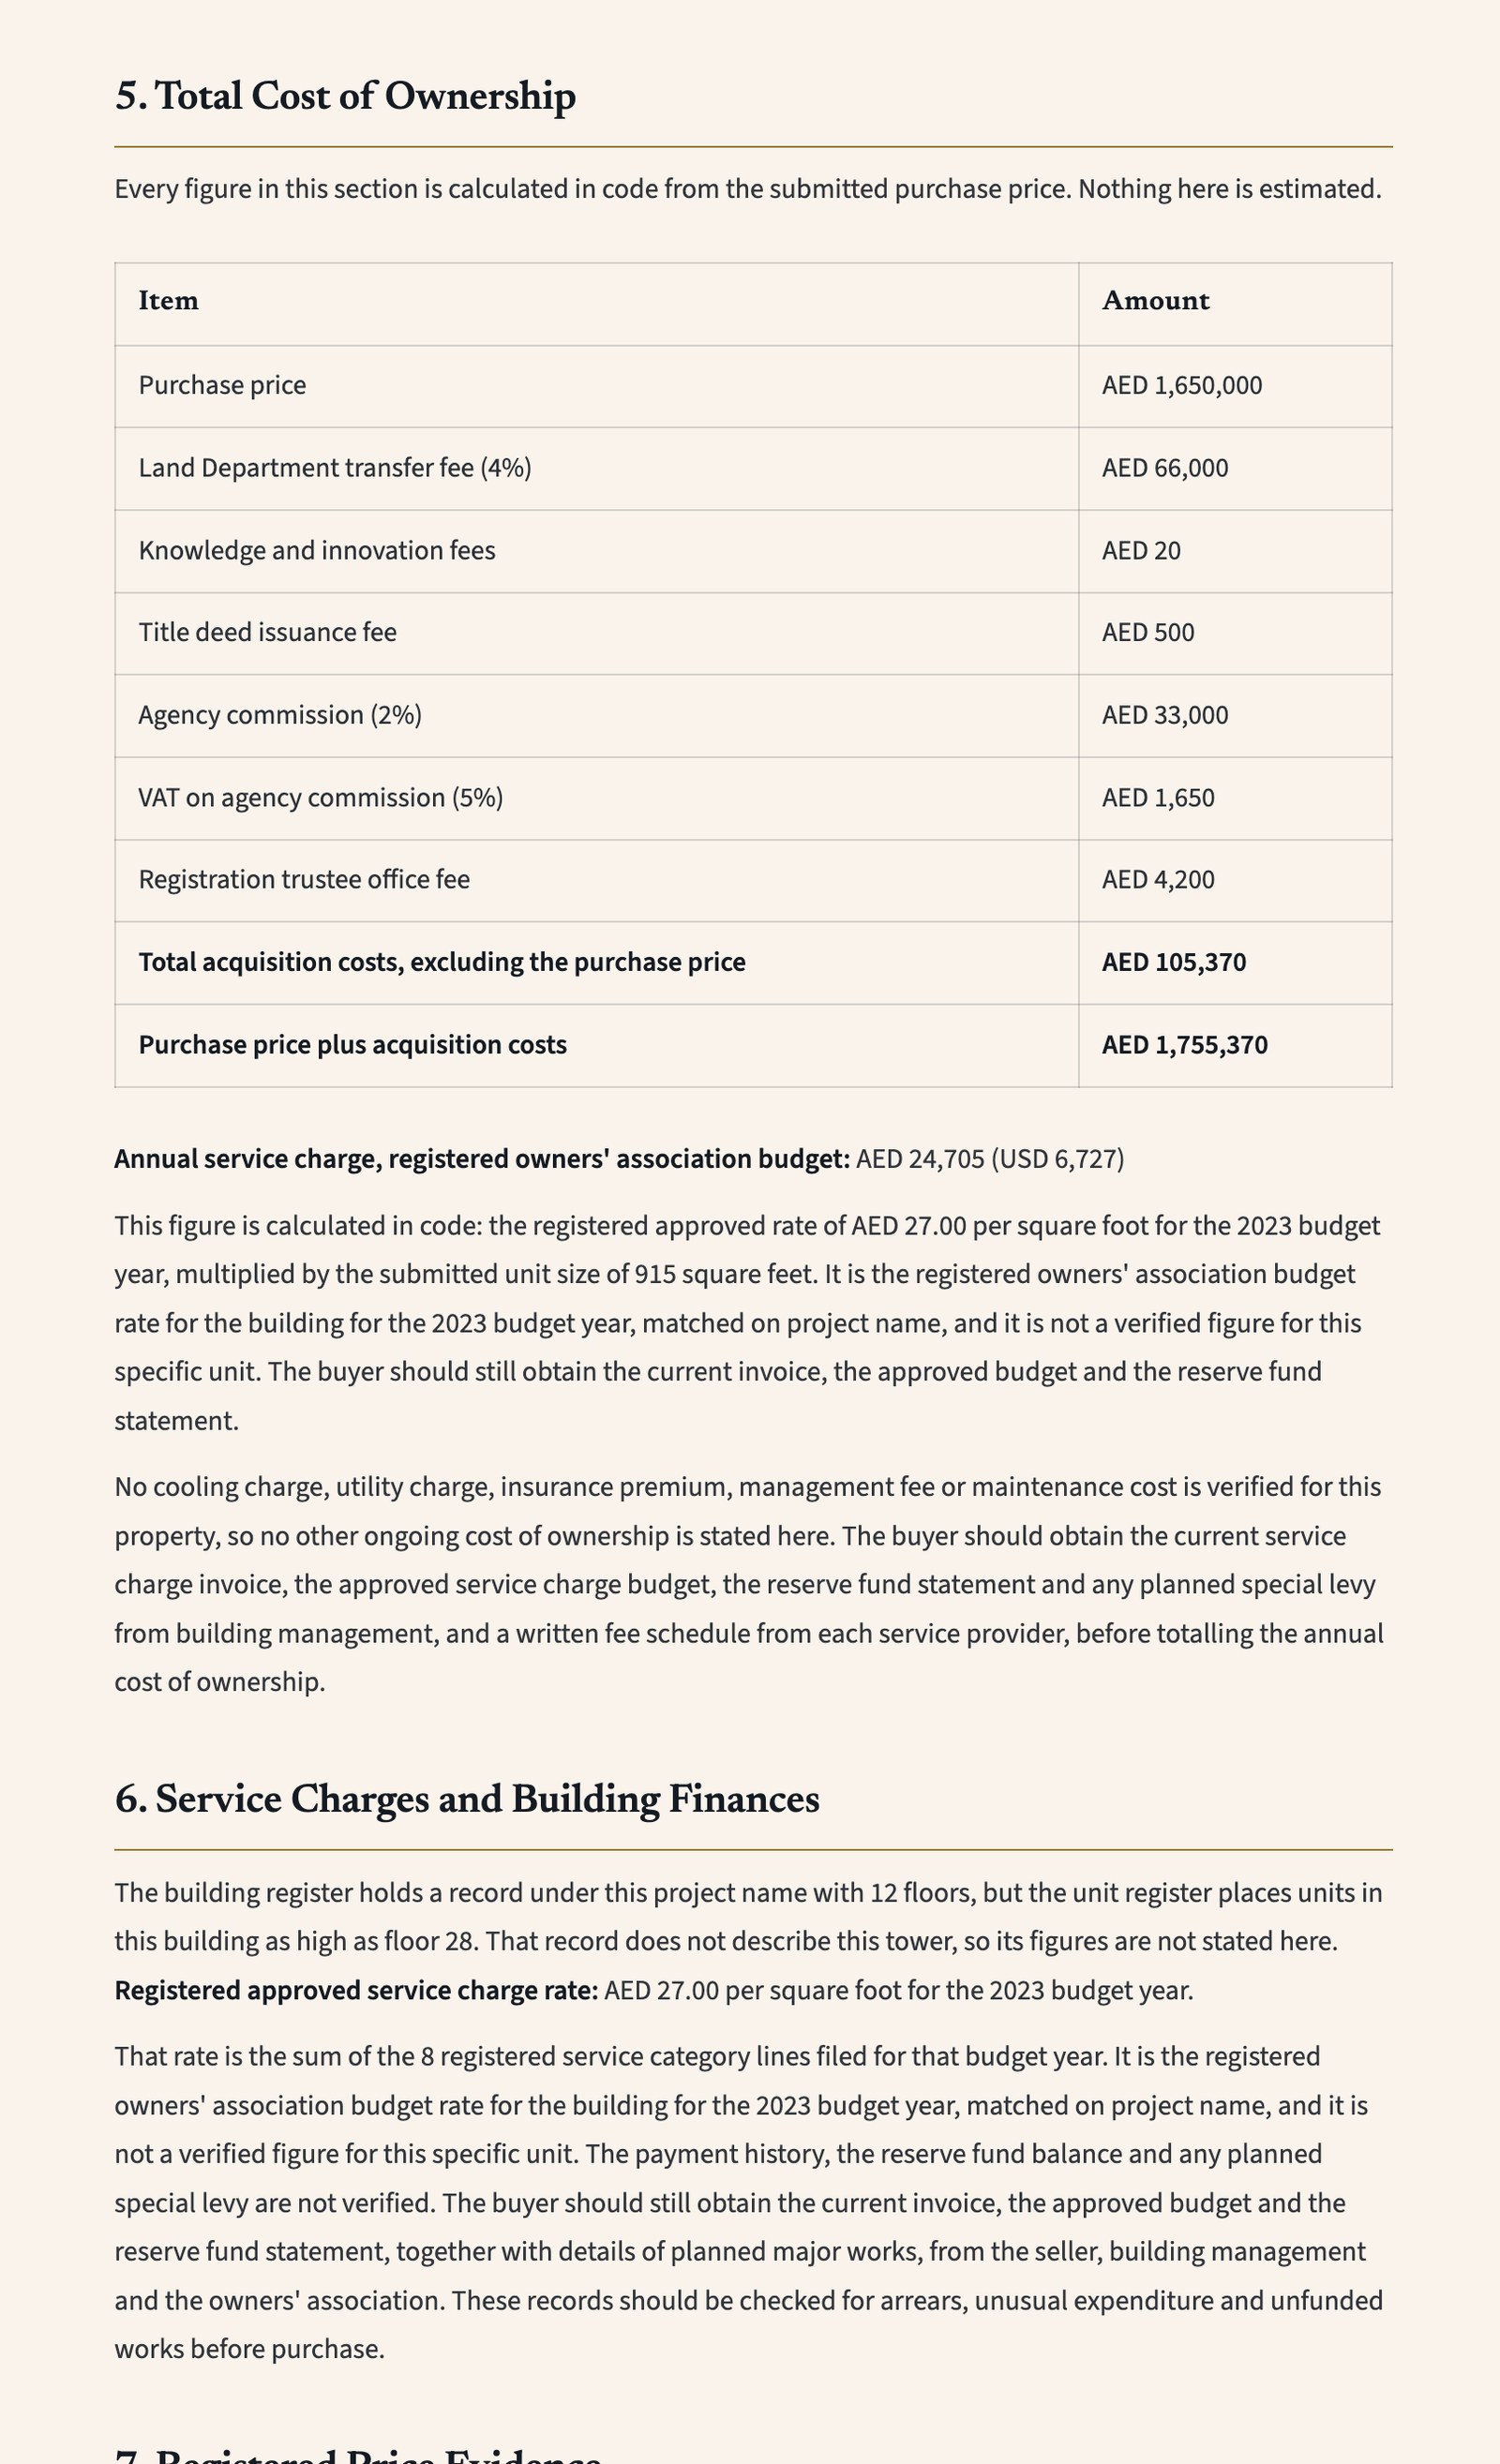
The full sample is 24 pages on a real Business Bay apartment. Nothing in it is illustrative.
Download the full sample, PDF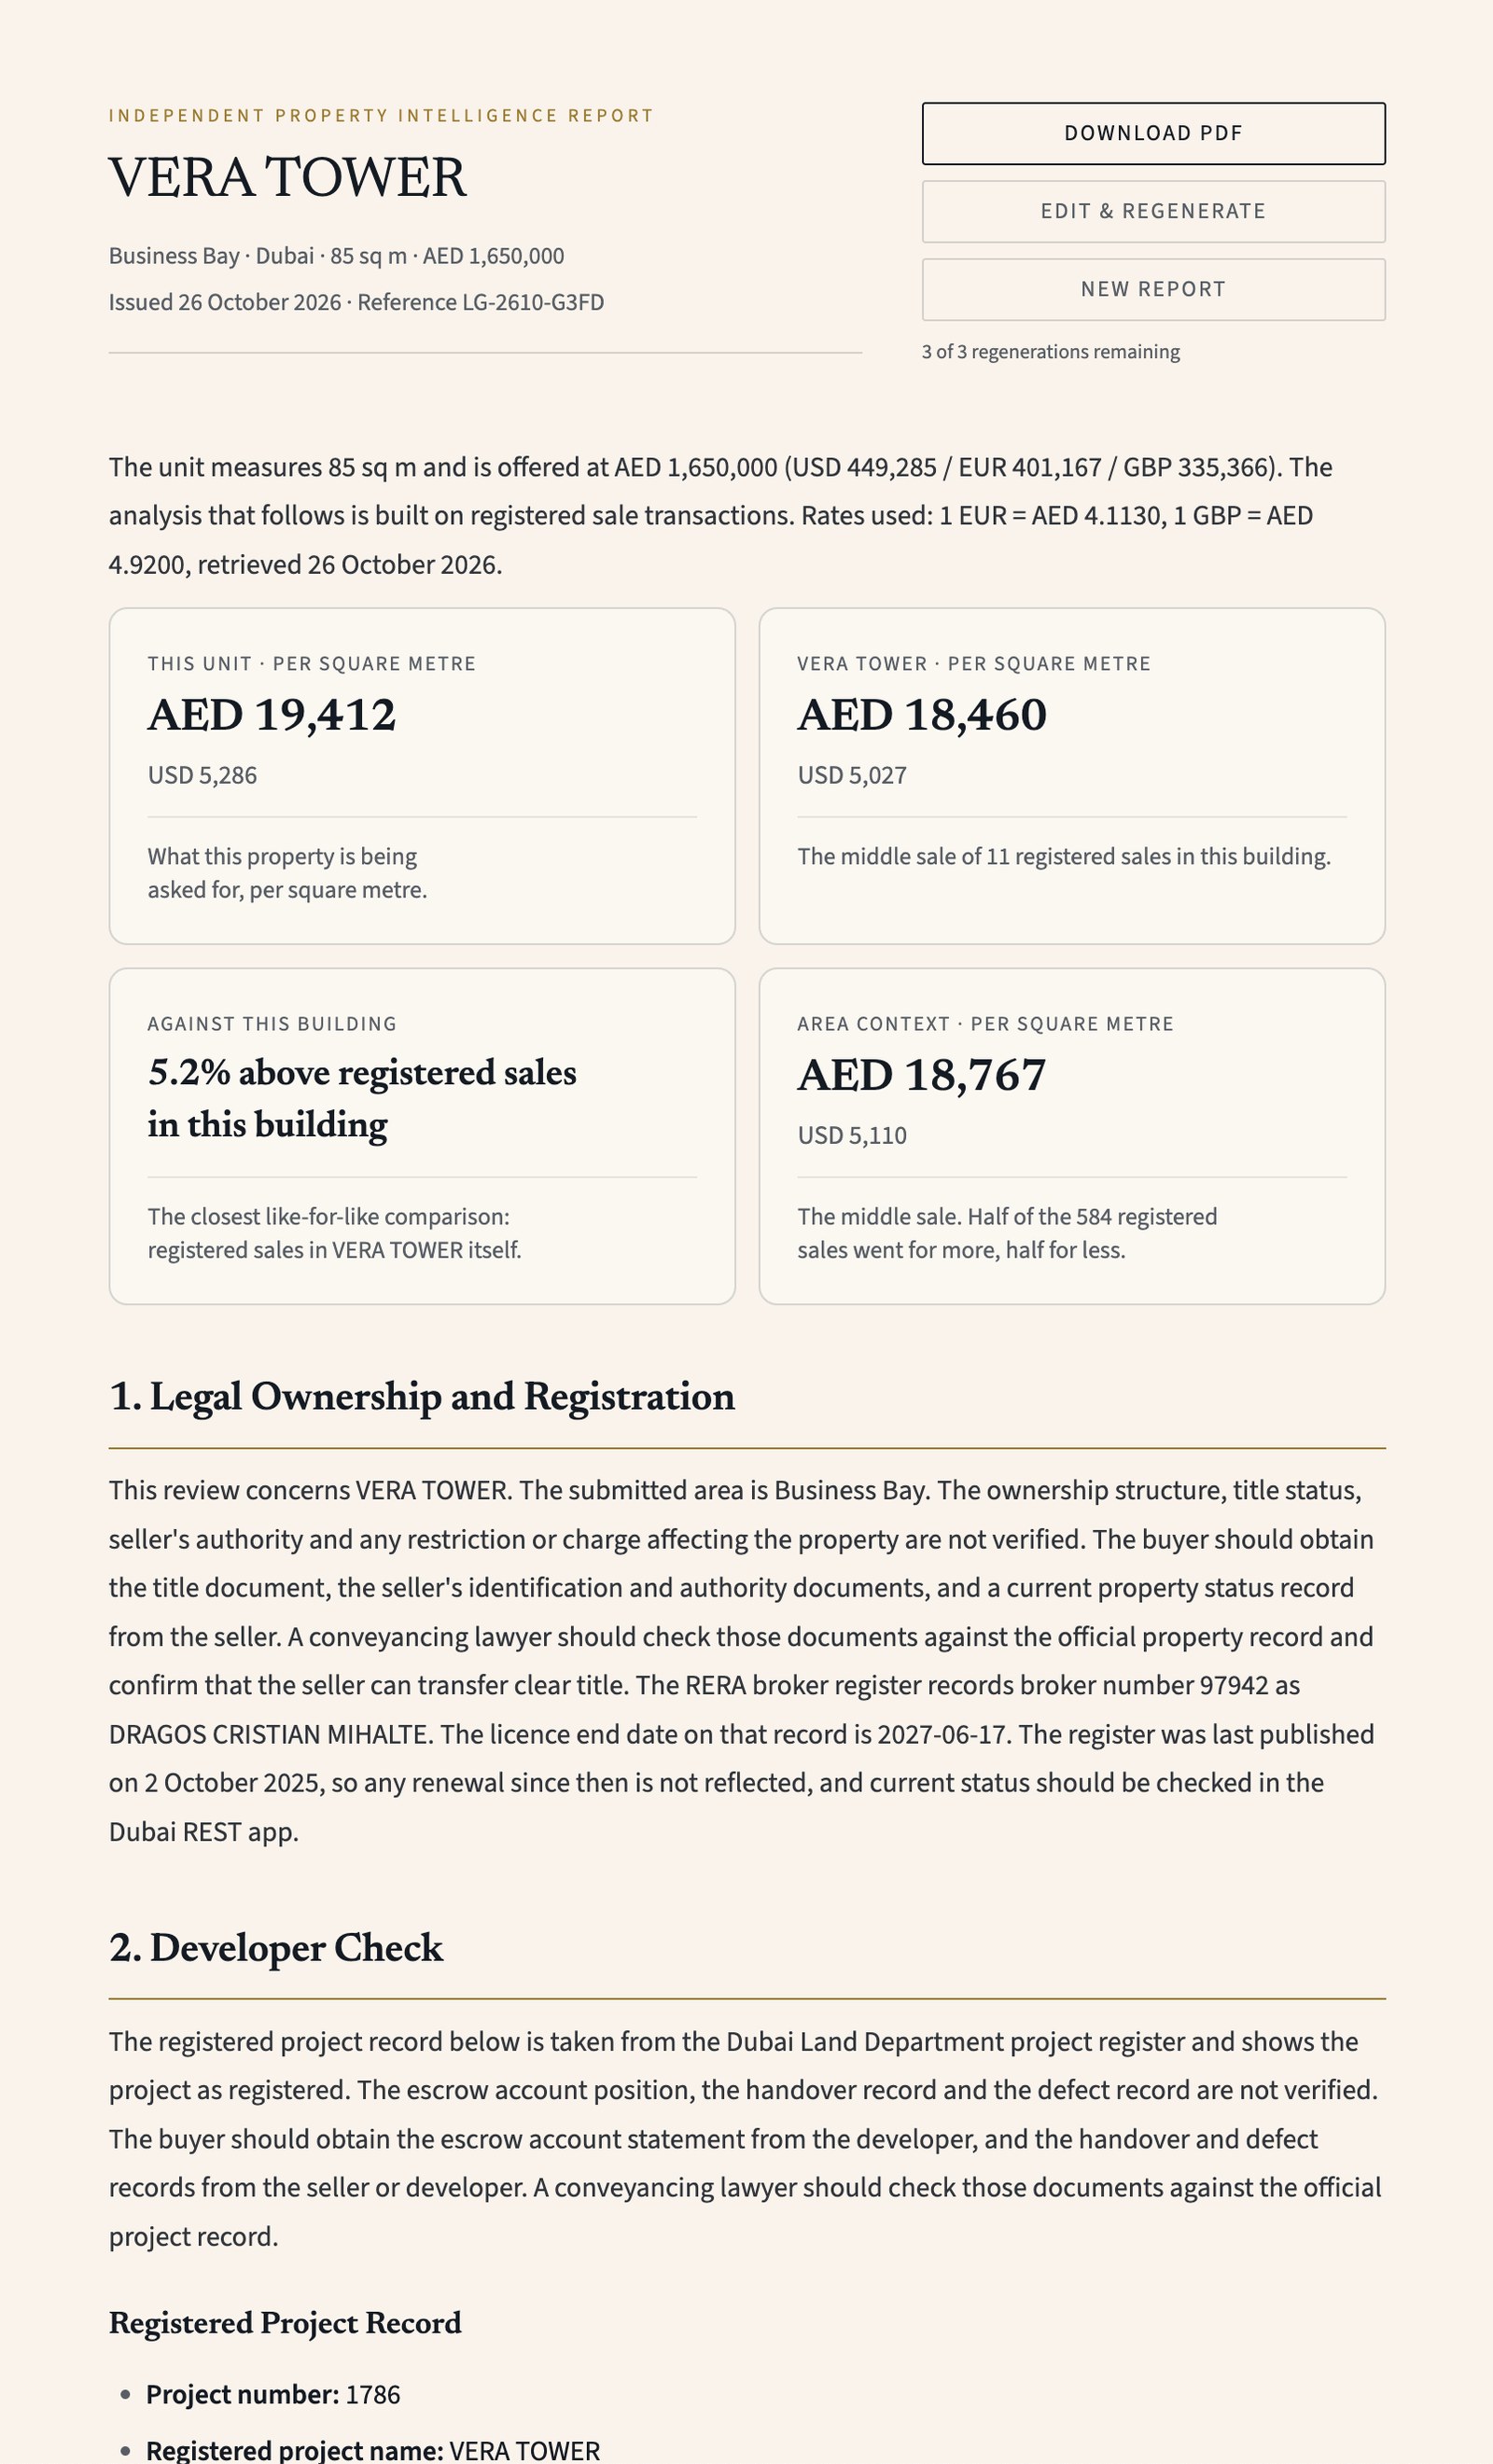
Pricing
Three free reports, no card required. A full report is USD 150.
See plans and what each report containsCustom analytics
When no standard report answers the question
We build the analysis to order from the same official registers: price growth across a community, launch prices phase by phase, one building against another, or a set of holdings against their areas. Each piece is delivered as a Ledgard data note, in English or Chinese, with every figure traced to its register.
- Scope and price agreed before any work starts
- Delivered as a PDF data note, with the full method
Write to us with the question, and we will reply with the scope and a price.
Click to copyFree area report
Registered sales and rents for apartments and villas in any Dubai area, sent to your email.
Professional members get enriched area reports, with sales by bedroom count, a monthly price trend and an area yield indication.
Worked examples, in plain English
What buying and holding Dubai property actually costs, worked through on real numbers rather than brochure figures.
- 15 November 2026Service charges in Downtown Dubai: what the 2026 budgets showIn the 2026 budgets for 40 Downtown buildings, the middle half charge between AED 18.49 and AED 29.82 per square foot a year. On a 1,400 square foot apartment, that gap is AED 15,862 (USD 4,319) a year, and most charges fell between 2024 and 2026.Read the article →
- 27 October 2026Below market? Six checks before you believe itIn a slower market, more listings claim to be below market. Some are. Six checks against the registered record tell you which, with a worked example.Read the article →
- 26 October 2026Dubai property market, Q3 2026: a steadier quarter in primeRegistered sales fell for a third quarter, but apartment prices in the same buildings held in the prime areas, lettings rose 66% and DIFC appears for the first time. Price per square foot, villas, yields and the top of the market, with the full report as a PDF.Read the article →